
Founder and Principal Consultant

| Draw # | Date | CRS Cut-off | Invitations Issued | Category | Days between Draws |
|---|---|---|---|---|---|
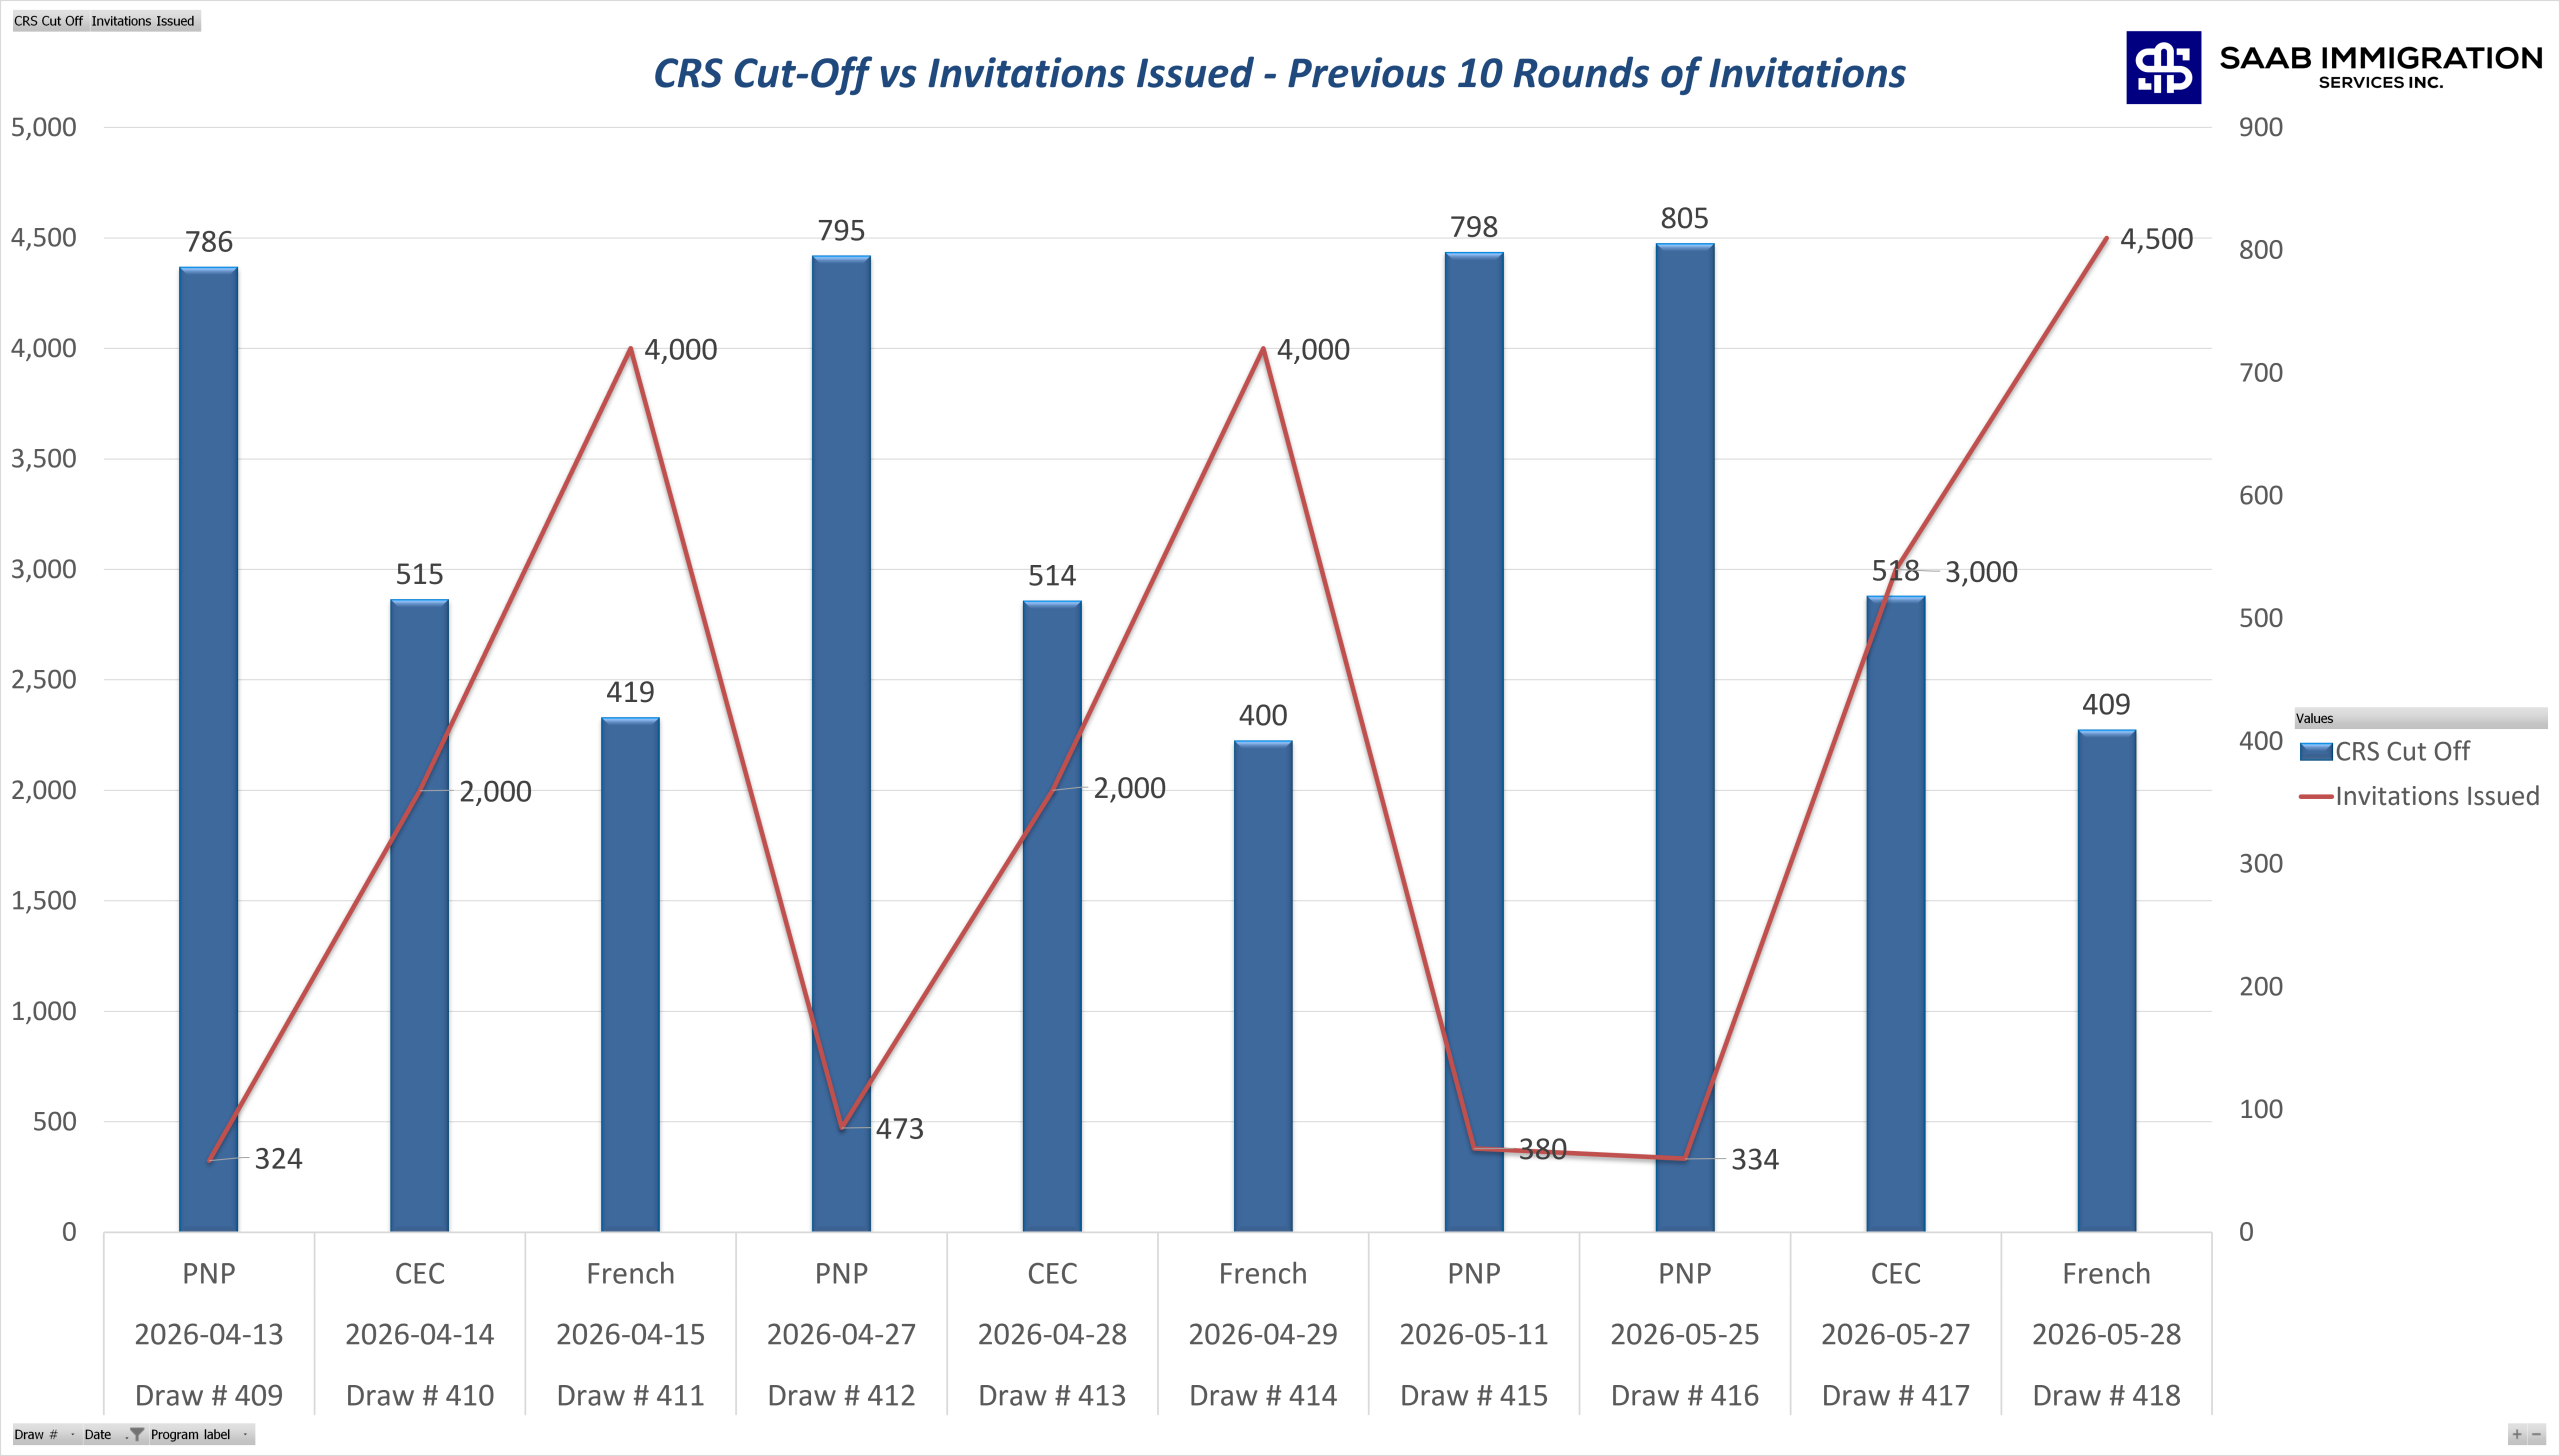
| 409 | 13-Apr-26 | 786 | 324 | Provincial Nominee Program | 11 |
| 410 | 14-Apr-26 | 515 | 2,000 | Canadian Experience Class | 1 |
| 411 | 15-Apr-26 | 419 | 4,000 | French | 1 |
| 412 | 27-Apr-26 | 795 | 473 | Provincial Nominee Program | 12 |
| 413 | 28-Apr-26 | 514 | 2,000 | Canadian Experience Class | 1 |
| 414 | 29-Apr-26 | 400 | 4,000 | French | 1 |
| 415 | 11-May-26 | 798 | 380 | Provincial Nominee Program | 12 |
| 416 | 25-May-26 | 805 | 334 | Provincial Nominee Program | 14 |
| 417 | 27-May-26 | 518 | 3,000 | Canadian Experience Class | 2 |
| 418 | 28-May-26 | 409 | 4,500 | French | 1 |

| Quarter | 2023 | 2024 | 2025 | 2026* | Total |
|---|---|---|---|---|---|
| Q1 | 37,559 | 26,695 | 30,683 | 55,830 | 150,767 |
| Q2 | 21,989 | 16,759 | 11,162 | — | 49,910 |
| Q3 | 26,500 | 41,420 | 23,993 | — | 91,913 |
| Q4 | 24,218 | 14,029 | 48,160 | — | 86,407 |
| Total | 110,266 | 98,903 | 113,998 | 55,830 | 378,997 |
*Last Update on March 31, 2026

| Period | All-program | CEC | Education | French | Healthcare & Social Services | Other targeted | PNP | STEM | Trades | Total |
|---|---|---|---|---|---|---|---|---|---|---|
| 2023 | — | |||||||||
| Q1 | 71% | 0% | 0% | 0% | 0% | 9% | 21% | 0% | 0% | 100% |
| Q2 | 95% | 0% | 0% | 0% | 2% | 0% | 3% | 0% | 0% | 100% |
| Q3 | 53% | 0% | 0% | 32% | 6% | 2% | 0% | 2% | 6% | 100% |
| Q4 | 40% | 0% | 0% | 5% | 15% | 4% | 6% | 24% | 4% | 100% |
| 2024 | — | |||||||||
| Q1 | 41% | 0% | 0% | 41% | 13% | 4% | 0% | 0% | 0% | 100% |
| Q2 | 20% | 18% | 0% | 8% | 0% | 0% | 27% | 27% | 0% | 100% |
| Q3 | 0% | 53% | 0% | 19% | 9% | 0% | 15% | 0% | 4% | 100% |
| Q4 | 0% | 12% | 0% | 19% | 21% | 0% | 35% | 0% | 13% | 100% |
| 2025 | — | |||||||||
| Q1 | 0% | 30% | 0% | 60% | 0% | 0% | 9% | 0% | 0% | 100% |
| Q2 | 0% | 58% | 9% | 0% | 9% | 0% | 24% | 0% | 0% | 100% |
| Q3 | 0% | 21% | 10% | 29% | 27% | 0% | 7% | 0% | 5% | 100% |
| Q4 | 0% | 31% | 0% | 47% | 15% | 0% | 8% | 0% | 0% | 100% |
| 2026* | — | |||||||||
| Q1 | 0% | 54% | 0% | 32% | 7% | 1% | 5% | 0% | 0% | 100% |
| Grand Total | 23% | 24% | 1% | 26% | 9% | 2% | 10% | 3% | 2% | 100% |
*Last Update on March 31, 2026

| Year | Average Invitations per Draw |
|---|---|
| 2022 | 1,939 |
| 2023 | 2,625 |
| 2024 | 1,902 |
| 2025 | 1,965 |
| 2026* | 2,938 |
| Cumulative Average | 2,182 |
*Last Update on March 31, 2026
")
| Period | All-program | CEC | Education | French | Healthcare & Social Services | Other targeted | PNP | STEM | Trades | Total Draws |
|---|---|---|---|---|---|---|---|---|---|---|
| 2023 | 18 | — | — | 7 | 3 | 4 | 6 | 2 | 2 | 42 |
| Q1 | 4 | — | — | — | — | 1 | 4 | — | — | 9 |
| Q2 | 5 | — | — | — | 1 | — | 1 | — | — | 7 |
| Q3 | 6 | — | — | 5 | 1 | 1 | — | 1 | 1 | 15 |
| Q4 | 3 | — | — | 2 | 1 | 2 | 1 | 1 | 1 | 11 |
| 2024 | 9 | 10 | — | 11 | 3 | 2 | 14 | 1 | 2 | 52 |
| Q1 | 7 | — | — | 3 | 1 | 2 | — | — | — | 13 |
| Q2 | 2 | 1 | — | 1 | — | — | 2 | 1 | — | 7 |
| Q3 | — | 5 | — | 4 | 1 | — | 6 | — | 1 | 17 |
| Q4 | — | 4 | — | 3 | 1 | — | 6 | — | 1 | 15 |
| 2025 | — | 15 | 2 | 9 | 7 | — | 24 | — | 1 | 58 |
| Q1 | — | 3 | — | 3 | — | — | 5 | — | — | 11 |
| Q3 | — | 3 | 1 | 2 | 2 | — | 7 | — | 1 | 16 |
| Q4 | — | 6 | — | 4 | 3 | — | 6 | — | — | 19 |
| 2026* | — | 5 | — | 3 | 1 | 2 | 6 | — | — | 16 |
| Q1 | — | 6 | — | 3 | 1 | 2 | 7 | — | — | 19 |
| Cumulative Total | 27 | 31 | 2 | 30 | 14 | 8 | 51 | 3 | 5 | 171 |
*Last Update on March 31, 2026
")
| Year | All-program | CEC | Education (Introduced 2025) |
French | FST | Healthcare & Social Services | Other targeted (Expanded 2026) |
PNP | STEM | Trades | Total Draws |
|---|---|---|---|---|---|---|---|---|---|---|---|
| 2020 | 16 | 10 | — | — | 1 | — | — | 10 | — | — | 37 |
| 2021 | — | 17 | — | — | — | — | — | 25 | — | — | 42 |
| 2022 | 11 | — | — | — | — | — | 13 | — | — | — | 24 |
| 2023 | 18 | — | — | 7 | — | 3 | 4 | 6 | 2 | 2 | 42 |
| 2024 | 9 | 10 | — | 11 | — | 3 | 2 | 14 | 1 | 2 | 52 |
| 2025 | — | 15 | 2 | 9 | — | 7 | — | 24 | — | 1 | 58 |
| 2026* | — | 6 | — | 3 | — | 1 | 2 | 7 | — | — | 19 |
| Grand Total | 54 | 58 | 2 | 30 | 1 | 14 | 8 | 99 | 3 | 5 | 274 |
* Last Update on March 31, 2026

| Year | All-program | CEC | Education | French | Healthcare & Social Services | Other targeted | PNP | STEM | Trades |
|---|---|---|---|---|---|---|---|---|---|
| 2023 | 503 | — | — | 445 | 457 | 416 | 705 | 484 | 407 |
| 2024 | 536 | 524 | — | 413 | 443 | 434 | 725 | 491 | 435 |
| 2025 | — | 529 | 471 | 422 | 481 | — | 753 | — | 505 |
| 2026* | — | 509 | — | 397 | 467 | 299 | 750 | — | — |
*Last Update on March 31, 2026

Insight: Draw frequency has accelerated significantly since 2020, with 2026 showing the fastest pace on record — averaging one draw every 5 days.
| Year | Average Days Between Draws |
|---|---|
| 2015 | 15 |
| 2016 | 14 |
| 2017 | 12 |
| 2018 | 13 |
| 2019 | 14 |
| 2020 | 10 |
| 2021 | 9 |
| 2022 | 14 |
| 2023 | 9 |
| 2024 | 7 |
| 2025 | 6 |
| 2026* | 5 |
| Cumulative Average | 10 |
*Last Update on March 31, 2026

| Year | Total Draws | Draws per Month |
|---|---|---|
| 2015 | 23 | 1.9 |
| 2016 | 27 | 2.3 |
| 2017 | 30 | 2.5 |
| 2018 | 28 | 2.3 |
| 2019 | 26 | 2.2 |
| 2020 | 37 | 3.1 |
| 2021 | 42 | 3.5 |
| 2022 | 24 | 2.0 |
| 2023 | 42 | 3.5 |
| 2024 | 52 | 4.3 |
| 2025 | 58 | 4.8 |
| 2026* | 19 | 6.3 |
*Last Update on March 31, 2026