

Q2 2026 Snapshot, As of June 30, 2026
- Total Draws in Q2 2026: 15 rounds of invitations
- Total ITAs Issued in Q2 2026: 33,237
- 2026 YTD Total (Q1 + Q2): 89,067 ITAs across 34 draws
- Dominant Categories: French (38%), CEC (33%), Healthcare (12%)
- Average CRS, CEC draws in 2026: 512
- Draw Frequency: 5.7 draws per month, fastest half-year pace on record
As Q2 2026 closes, the data tells a clear story. Express Entry draws pulled back sharply in volume from Q1’s record-breaking pace, exactly as historical patterns predicted, and the setup for a more active Q3 is now firmly in place. This post captures the full Q2 2026 snapshot as a permanent archive before the main Express Entry Draws & Trends page is updated for Q3.
1. Quarterly Invitations: How Many Express Entry Draws in Q2 2026?
Tip: Swipe/scroll sideways if viewing on mobile →

Q1 2026 issued a record-breaking 55,830 ITAs, the highest single quarter in Express Entry history. Q2 followed with 33,237 ITAs, a drop of 40% quarter-over-quarter. This is not a policy reversal. It is a predictable seasonal correction.
Look at the pattern across every year in the chart above. Q2 consistently underperforms Q1, in 2023 (37,559 → 21,989), in 2024 (26,695 → 16,759), and in 2025 (30,683 → 11,162). The Q1-to-Q2 dip is structural, not alarming. What makes 2026 different is the scale of Q1, the base was so high that even a 40% Q2 pullback still produces a stronger Q2 than any year since 2023.
| Quarter | 2023 | 2024 | 2025 | 2026 |
|---|---|---|---|---|
| Q1 | 37,559 | 26,695 | 30,683 | 55,830 |
| Q2 | 21,989 | 16,759 | 11,162 | 33,237 |
| Q3 | 26,500 | 41,420 | 23,993 | Pending |
| Q4 | 24,218 | 14,029 | 48,160 | Pending |
| Annual Total | 110,266 | 98,903 | 113,998 | 89,067 (H1) |
With 89,067 ITAs already issued in the first half of 2026, Canada is on pace to surpass 2025’s full-year total of 113,998, if Q3 and Q4 follow historical rebounds.
2. Category Share, French Surges, CEC Moderates

Q2 2026 saw a significant shift in category distribution compared to Q1. The two tables below present the complete picture, raw numbers first, then share percentages with context.
Invitations & Draws by Category, Raw Numbers
| Category | Q1 2026 ITAs (Draws) |
Q2 2026 ITAs (Draws) |
Change in ITAs |
|---|---|---|---|
| CEC | 30,250 (6 draws) | 11,000 (4 draws) | ▼ 19,250 (−64%) |
| French | 18,000 (3 draws) | 12,500 (3 draws) | ▼ 5,500 (−31%) |
| Healthcare & Social Services | 4,000 (1 draw) | 4,000 (1 draw) | = No change |
| PNP | 2,939 (7 draws) | 2,466 (5 draws) | ▼ 473 (−16%) |
| Trades | 0 (0 draws) | 3,000 (1 draw) | ▲ 3,000 (New) |
| Other targeted (Physicians, Sr. Managers) |
641 (2 draws) | 271 (1 draw) | ▼ 370 (−58%) |
| Total | 55,830 (19 draws) | 33,237 (15 draws) | ▼ 22,593 (−40%) |
Share of Total Quarterly ITAs by Category
Note: Share shifts can reflect volume changes in other categories, not just the category itself. Always read alongside the raw numbers above.
| Category | Q1 2026 | Q2 2026 | Change (% pts) |
|---|---|---|---|
| CEC | 54% | 33% | ▼ 21 pts |
| French | 32% | 38% | ▲ 6 pts |
| Healthcare & Social Services | 7% | 12% | ▲ 5 pts (same ITAs, share rose as total fell) |
| PNP | 5% | 7% | ▲ 2 pts |
| Trades | 0% | 9% | ▲ 9 pts |
| Other targeted | 1% | 1% | , |
| Total | 100% | 100% | , |
French-language proficiency draws dominated Q2 with 38% of all ITAs, the highest French share since Q4 2025 (47%). This reflects IRCC’s continued commitment to Francophone immigration targets outside Quebec. Trades reappeared after being absent in Q1, a single draw (CRS 477, 3,000 ITAs) accounted for the full 9% Trades share. Healthcare held exactly 4,000 ITAs across both quarters, its rising share is a mathematical artefact of overall volume compression, not increased IRCC commitment.
3. Average Invitations per Draw, The Compression Effect

Q2 2026 averaged 2,216 ITAs per draw, down from Q1’s 2,938, but still well above the dismal Q2 2025 figure of 930. The pattern across all years shows Q2 as the weakest quarter for draw size, driven by the prevalence of smaller targeted draws that cluster in the April, June period.
The 2026 full-year average through Q2 now sits at 2,620 ITAs per draw, well above the 2024 (1,902) and 2025 (1,965) full-year averages. This reflects the large CEC draws that dominated Q1 2026, pulling the annual average up significantly even as Q2 brought smaller, more targeted rounds.
4. Draw Frequency by Category, Pace Holds Despite Volume Drop

Q2 2026 held 15 rounds across 6 categories, down from Q1’s 19, but consistent with the historical Q2 pullback seen in every year since 2023. The breakdown:
| Category | Q1 2026 Draws | Q2 2026 Draws | Change |
|---|---|---|---|
| CEC | 6 | 4 | ▼ 2 |
| French | 3 | 3 | , |
| PNP | 7 | 5 | ▼ 2 |
| Healthcare & Social Services | 1 | 1 | , |
| Other targeted (Physicians, Sr. Managers) | 2 | 1 | ▼ 1 |
| Trades | 0 | 1 | ▲ 1 (returned) |
| Total | 19 | 15 | ▼ 4 |
PNP draws remained a consistent presence, 5 in Q2, though at progressively higher CRS cut-offs (766 average in 2026 vs. 753 in 2025). This reflects tightening competition among provincial nominees as the pool grows.
5. Modern Draw Patterns, 2026 Is a New Era
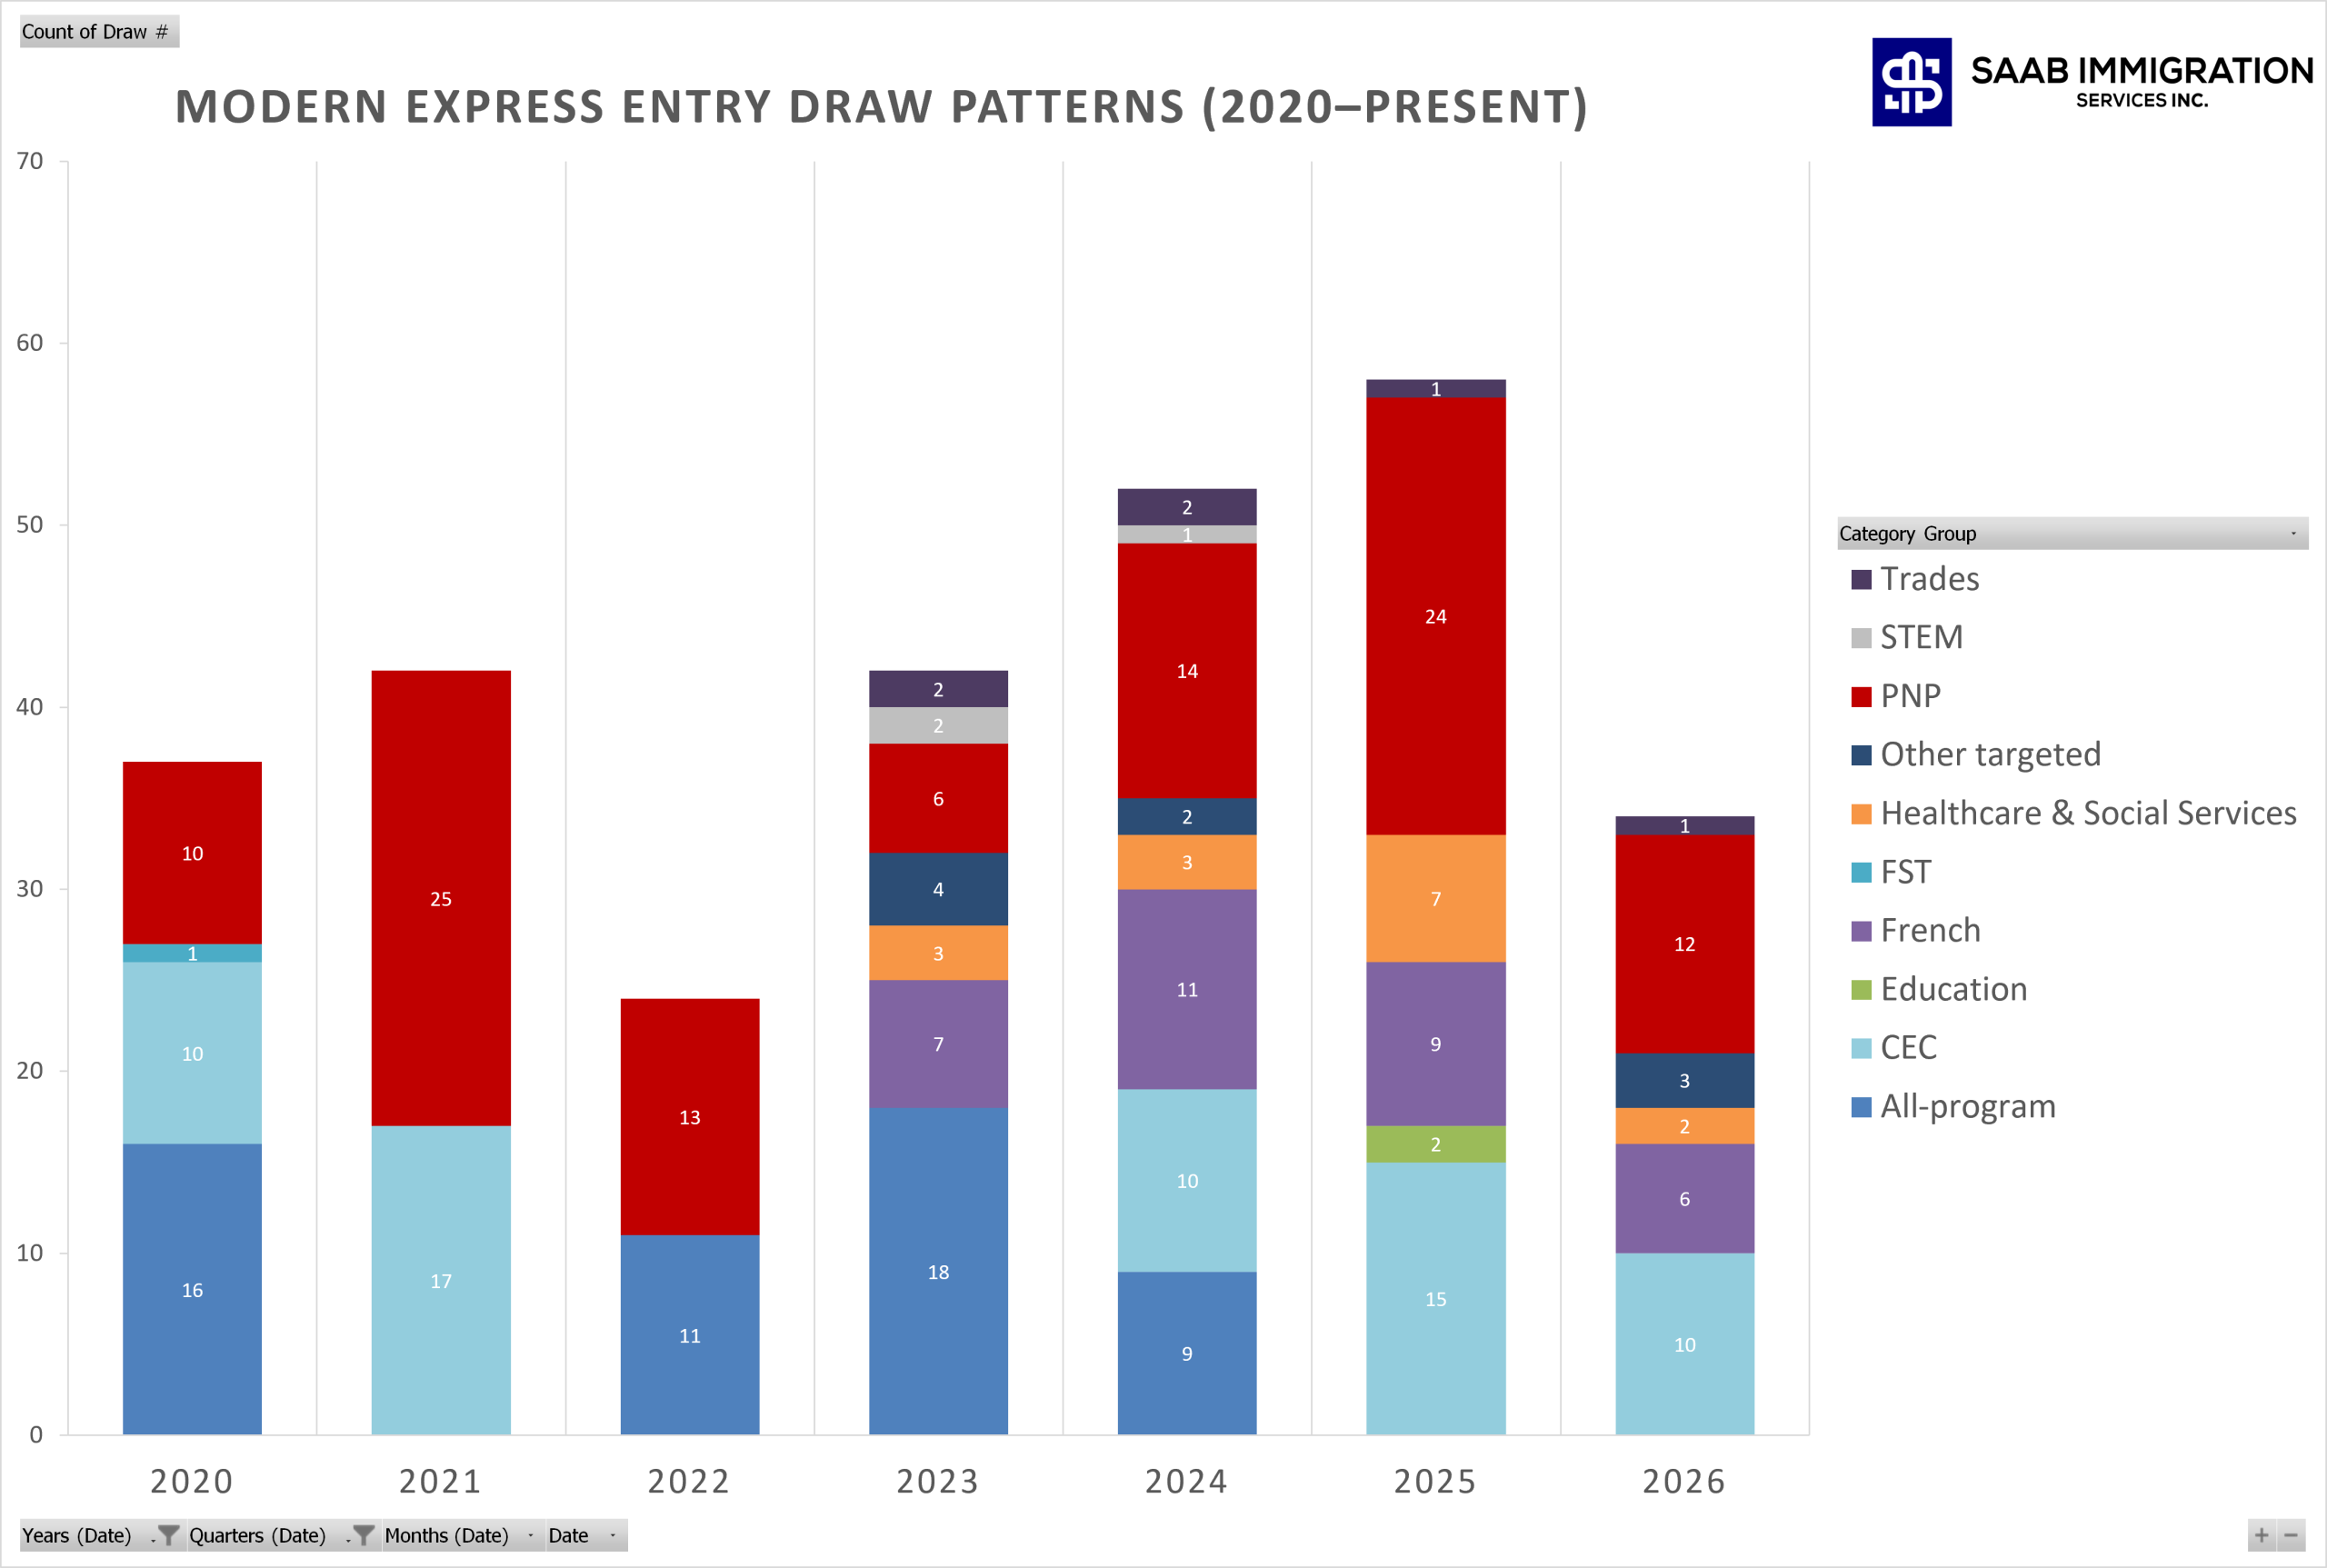
The long-view chart makes the structural shift unmistakable. 2026 through Q2 already shows 34 draws across 7 distinct categories. The addition of Senior Managers, Researchers, and Physicians as standalone categories means IRCC is now using Express Entry with surgical precision, targeting specific labour market gaps rather than broad volume.
The “All-program” era, which dominated from 2015 to 2022, is effectively over. All-program draws accounted for 0% of 2026 activity through Q2. Every ITA issued in 2026 has been tied to a specific program, category, or language profile.
6. CRS Cut-offs by Category, 2026 Brings Historically Low Floors

| Category | 2023 Avg CRS | 2024 Avg CRS | 2025 Avg CRS | 2026 Avg CRS* |
|---|---|---|---|---|
| CEC | , | 524 | 529 | 512 |
| French | 445 | 413 | 422 | 403 |
| Healthcare & Social Services | 457 | 443 | 481 | 471 |
| PNP | 705 | 725 | 753 | 766 |
| Other targeted | 416 | 434 | , | 274 |
| Trades | 407 | 435 | 505 | 477 |
*2026 as of June 30, 2026 (Q2 end)
The most dramatic figure is Other targeted at CRS 274, driven by Physicians with Canadian Work Experience draws (CRS 169 and 223). These draws operate outside the normal CRS framework entirely. CEC cut-offs have eased from 529 (2025) to 512 (2026), a meaningful improvement for candidates in the 510 to 525 range who were locked out through most of 2025. French has also dropped to 403 average, its lowest since 2024.
7. Draw Gap, One Every 5.4 Days

2026 is averaging one draw every 5.4 days through Q2, continuing the unbroken downward trend in draw gaps since 2022. Candidates no longer wait two weeks between draws; the system now operates more like a continuous selection mechanism. Two practical implications:
- Missing one draw matters less, another round is typically less than a week away
- CRS score requirements in any given draw are more unpredictable, a sudden large draw can move cut-offs significantly with little warning
8. Draw Frequency, 5.7 Per Month in 2026

| Year | Total Draws | Draws per Month |
|---|---|---|
| 2022 | 24 | 2.0 |
| 2023 | 42 | 3.5 |
| 2024 | 52 | 4.3 |
| 2025 | 58 | 4.8 |
| 2026* | 34 (H1) | 5.7 |
*2026 as of June 30, 2026 (Q2 end, 34 draws across 6 months)
At 5.7 draws per month through Q2, 2026 is running ahead of every prior year. If this pace holds into Q3 and Q4, 2026 will easily surpass 2025’s record of 58 annual draws, potentially reaching 65 to 70 draws for the full year.
📊 Q2 2026 Analysis, What the Data Tells Us
- The Q2 pullback was expected and followed the pattern precisely. Every year since 2023 has shown a Q1-to-Q2 decline in total ITAs. 2026 is not an exception, it is confirmation that the pattern is structural.
- French dominance in Q2 is a policy signal, not an anomaly. At 38% of Q2 ITAs and 12,500 invitations across just 3 draws, French-language draws are now a permanent fixture of Q2. IRCC’s Francophone immigration targets outside Quebec are legally mandated and will continue to drive significant Q2 volume regardless of overall draw trends.
- CEC eased meaningfully. The 2026 average CEC cut-off of 512, versus 529 in 2025, is the most significant positive development for general Express Entry candidates this year. Candidates in the 510 to 520 range who were mathematically excluded throughout 2025 now have a realistic window.
- Other targeted draws are redefining the floor. Physician draws at CRS 169 and 223 signal that occupation and Canadian work experience now trump CRS score entirely in certain categories. The era of “your CRS score determines your fate” is giving way to a more nuanced system.
- PNP pressure is building. The 766 average PNP CRS in 2026 (up from 753 in 2025 and 725 in 2024) reflects a competitive provincial nominee pool. Provincial nominations remain the most powerful CRS booster (+600 points) but competition for those nominations is growing.
- Healthcare’s rising share is a statistical artefact. The 7% → 12% jump reflects total volume compression, not IRCC increasing Healthcare commitment. Same 4,000 ITAs in both quarters, read the raw numbers, not just the share.
The CEC vs. French Divide, A Closer Look at Who Gets Invited
CEC-Specific Draws, 2025 to Q2 2026
Tip: Swipe/scroll sideways if viewing on mobile →

French-Language Draws, 2025 to Q2 2026

CEC vs. French, Side by Side

The Numbers Side by Side
| Metric | CEC (2025, Q2 2026) | French (2025, Q2 2026) |
|---|---|---|
| Number of draws | 25 | 15 |
| Total ITAs issued | ~79,350 | ~83,500 |
| Average CRS cut-off | 521 | 419 |
| Lowest CRS cut-off | 507 | 379 |
| Highest single draw (ITAs) | 8,000 | 8,500 |
| Most common draw size | 1,000 to 3,000 | 4,500 to 6,500 |
| Average CRS gap | ~102 CRS points, French candidates invited at scores 102 points lower on average | |
What This Actually Means
A candidate with a CRS score of 520, built through years of Canadian work experience, an advanced degree, strong language scores, and a legitimate economic contribution, was receiving 1,000-ITA draws at cut-offs of 533+ for most of 2025. Many waited 12 to 18 months without an ITA.
During the same period, a French-language candidate with a CRS score of 379, 141 points lower, was being invited through draws issuing 6,000 to 8,500 ITAs at cut-offs as low as 379. Fewer draws, yet more total ITAs issued to the French category than CEC over this period.
This is not a criticism of French-speaking candidates, they meet the eligibility criteria and are entitled to apply. This is a structural observation about the system design. The Francophone immigration targets outside Quebec, mandated by the Official Languages Act and IRCC policy commitments, create a parallel selection track that operates largely independent of the CRS score framework that governs everyone else.
What CEC Candidates Should Do Right Now
✅ If your CRS is 510+: You are within striking distance of current CEC cut-offs. Ensure your profile is complete, current, and accurate, a draw at your score can come with little warning.
✅ If your CRS is 480 to 510: Explore every legal avenue to increase your score, secondary language testing, credential upgrades, sibling in Canada, arranged employment. Each point matters at this range.
✅ If you qualify for any category draw: Healthcare, Trades, Education, Transport, assess eligibility. Category draws at lower CRS cut-offs are the fastest legitimate pathwfocuay if you meet the NOC and experience criteria.
✅ If you have any French proficiency: Even a modest TEF score at CLB 7 can open the French-language draw pathway at dramatically lower CRS thresholds. If you have any French background, get tested.
What to Expect in Q3 2026, Dikshit Soni, RCIC
Based on three years of quarterly data and the Q2 2026 snapshot, here is my read on what Q3 is likely to bring:
Q3 2026 Outlook
- Volume rebound is likely. In 2023, Q3 bounced from 21,989 (Q2) to 26,500 (Q3). In 2024, Q3 exploded from 16,759 to 41,420. The Q3 rebound is the strongest consistent pattern in modern Express Entry data. With Q2 2026 at 33,237, a Q3 rebound toward 35,000 to 45,000 ITAs would follow historical norms.
- CEC draws should increase in size. Q3 historically sees larger CEC draws as IRCC balances the smaller targeted draws of Q2 with higher-volume CEC rounds. Watch for draws in the 3,000 to 6,000 range returning.
- STEM may return. STEM has been dormant since 2024. With the new Ministerial Instructions and a growing backlog of STEM-eligible candidates, a STEM draw in Q3 or Q4 is overdue.
- Draw frequency will likely stay above 5 per month. There is no indication IRCC intends to slow down. Candidates should be monitoring the pool weekly, not bi-weekly.
- The 1 million ITA milestone has been crossed. Express Entry has now issued over 1,006,521 Invitations to Apply since January 2015. The next milestone, and what IRCC does with the program heading into 2027 immigration targets, will define the second half of 2026.
Need Help Navigating Your Express Entry Profile?
Whether you’re waiting on a CEC draw, exploring French proficiency pathways, or trying to understand which category you qualify for, a strategy session with SAAB Immigration gives you a clear picture of where you stand and what your next move should be.
For the complete historical analysis including all data tables and charts from 2015 to present, visit our Express Entry Draws & CRS Trends page.
📅 Book a Consultation or call +1 (877) 683‑7222 (SAAB) or email us at hello@saabimmigration.ca.
Update, 1 September 2026. The year has since run to 51 rounds and more than 122,000 invitations, and at the category level it has turned out sharper than this review anticipated. We have taken the full year apart, round by round, in Healthcare and STEM Express Entry Draws 2026: Where Are They? — including every round of 2026, where the invitations actually went, and the February rule change that reshaped who qualifies.
